
Artifact detection · qEEG
Every artifact, found and labeled.
WaveFM, our EEG foundation model, labels every channel and time window as eye, muscle, chewing, shiver, electrode or clean. Flagged segments are excluded by your study's rules, or repaired where the study needs it.
- Eye
- Muscle
- Chewing
- Shiver
- Electrode
01 What it finds
Five artifact types, told apart.
Eye
Blinks and eye movements, strongest over the front of the head.
Muscle
Face, jaw and neck tension: fast, high-amplitude noise.
Chewing
Rhythmic bursts from jaw movement.
Shiver
Rhythmic tremor from cold or tension.
Electrode
Pops, drifts and loose contacts.
02 How it works
Upload, label, exclude.
Any headset
WaveFM works with any montage and any number of channels, so it fits the equipment you already use.
Consistent
The same rules for every recording, every time. No more two reviewers giving two answers.
Fully traceable
The original recording is always stored, and every excluded or repaired segment is marked.
03 qEEG analysis
Then the analysis, on clean data.
Keep the metrics you already use, or let us run the analysis: band power and ratios, standard qEEG, functional connectivity, group statistics and figures ready for publication.
Every result comes from data that passed the artifact step, so results stay comparable between sessions and sites. The report also records which artifact types were removed, so you can see what each metric was exposed to.
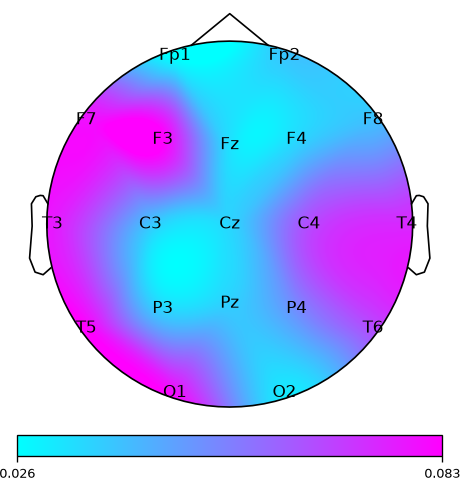
Node importance
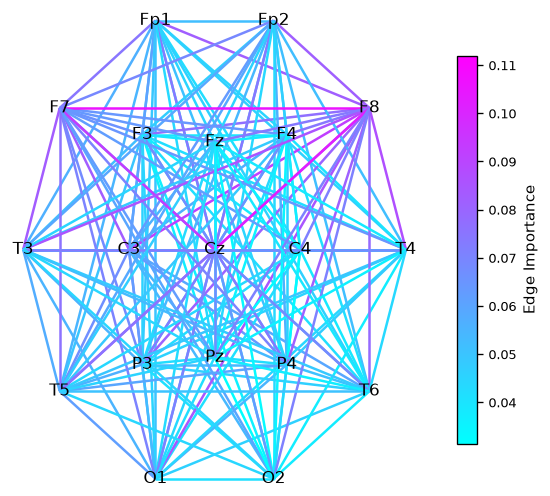
Functional connectivity · edge importance
Research use only. Not for diagnosis. Report contents are agreed with each customer.
Let's talk about your EEG data.
Tell us about your recordings and your study. We'll tell you how WaveFM can help.
Contact us →